Will Bitcoin go back up? Every crash since 2011 and its recovery time
Every Bitcoin fall of 50% or more since 2011: how long the low and the next high took, how 2025–26 compares, and which altcoins regained their old peaks.
Contents
- 01Every completed Bitcoin crash ended in a new high, after up to three years
- 02Smaller drops recovered in weeks, and most days are spent below a high
- 03How the 2025–2026 decline compares
- 04A moderate drawdown was not a safer entry point
- 05Altcoins often never regained their old peak
- 06How the numbers were calculated
- 07Will Bitcoin go back up after a crash?
- 08How long does Bitcoin take to recover from a bear market?
- 09Do altcoins recover to their all-time highs?
- 10Limitations
- 11Sources and data access
- 12Live prior 30-day hourly baseline — separate from the historical study
- 13Related live archives
- 14Related research
| Peak close | Peak (US$) | Lowest close | Max drawdown (%) | Days peak → low | Days low → new high | Days below peak |
|---|---|---|---|---|---|---|
| 2011-06-08 | 29.03 | 2011-11-18 | -92.7 | 163 | 459 | 622 |
| 2013-04-09 | 230.68 | 2013-07-06 | -71.2 | 88 | 122 | 210 |
| 2013-12-04 | 1,134.93 | 2015-01-14 | -84.5 | 406 | 771 | 1,177 |
| 2017-12-16 | 19,640.51 | 2018-12-15 | -83.8 | 364 | 716 | 1,080 |
| 2021-04-13 | 63,445.64 | 2021-07-20 | -53.1 | 98 | 91 | 189 |
| 2021-11-08 | 67,541.76 | 2022-11-09 | -76.7 | 366 | 481 | 847 |
| 2025-10-06 | 124,824.45 | 2026-06-30 (so far) | -53.0 (so far) | 267 (so far) | Not yet | 382+ (to 2026-10-23) |
View chart data
| Year | Days N | Deepest point vs prior high (%) | Days at least 20% below (%) | New all-time-high closes |
|---|---|---|---|---|
| 2011 | 365 | -92.7 | 67 | 38 |
| 2012 | 366 | -85.3 | 100 | 0 |
| 2013 | 365 | -71.2 | 71 | 52 |
| 2014 | 365 | -72.6 | 100 | 0 |
| 2015 | 365 | -84.5 | 100 | 0 |
| 2016 | 366 | -67.7 | 98 | 0 |
| 2017 | 365 | -35.8 | 15 | 74 |
| 2018 | 365 | -83.8 | 99 | 0 |
| 2019 | 365 | -82.9 | 100 | 0 |
| 2020 | 366 | -74.7 | 86 | 11 |
| 2021 | 365 | -53.1 | 50 | 22 |
| 2022 | 365 | -76.7 | 100 | 0 |
| 2023 | 365 | -75.4 | 100 | 0 |
| 2024 | 366 | -41.4 | 23 | 26 |
| 2025 | 365 | -32.1 | 23 | 12 |
| 2026 (to 23 Oct) | 296 | -53.0 | 100 | 0 |
View chart data
| Coin | 2017–18 peak close (date) | Back above | Days | 2021 peak close (date) | Back above | Days | vs all-time high on 2026-10-23 (%) |
|---|---|---|---|---|---|---|---|
| ETH | 1,380 (2018-01-13) | 2021-01-19 | 1,102 | 4,811 (2021-11-08) | 2025-08-22 | 1,383 | -50.6 |
| XRP | 2.75 (2018-01-07) | 2025-01-15 | 2,565 | 1.83 (2021-04-14) | 2024-11-30 | 1,326 | -63.6 |
| DOGE | 0.0168 (2018-01-07) | 2021-01-28 | 1,117 | 0.6853 (2021-05-07) | Not yet | 1,995+ | -88.5 |
| LTC | 359 (2017-12-18) | 2021-05-09 | 1,238 | 385 (2021-05-09) | Not yet | 1,993+ | -85.1 |
| ADA | 1.16 (2018-01-04) | 2021-02-26 | 1,149 | 2.97 (2021-09-02) | Not yet | 1,877+ | -92.9 |
| BNB | 22.35 (2018-01-06) | 2019-04-19 | 468 | 674 (2021-05-03) | 2024-06-04 | 1,128 | -43.6 |
| LINK | 1.36 (2018-01-08) | 2019-06-13 | 521 | 51.75 (2021-05-09) | Not yet | 1,993+ | -77.1 |
| BCH | 3,678 (2017-12-20) | Not yet | 3,229+ | 1,520 (2021-05-11) | Not yet | 1,991+ | -92.3 |
| XLM | 0.8802 (2018-01-03) | Not yet | 3,215+ | 0.7227 (2021-05-11) | Not yet | 1,991+ | -80.3 |
Every completed Bitcoin crash ended in a new high, after up to three years
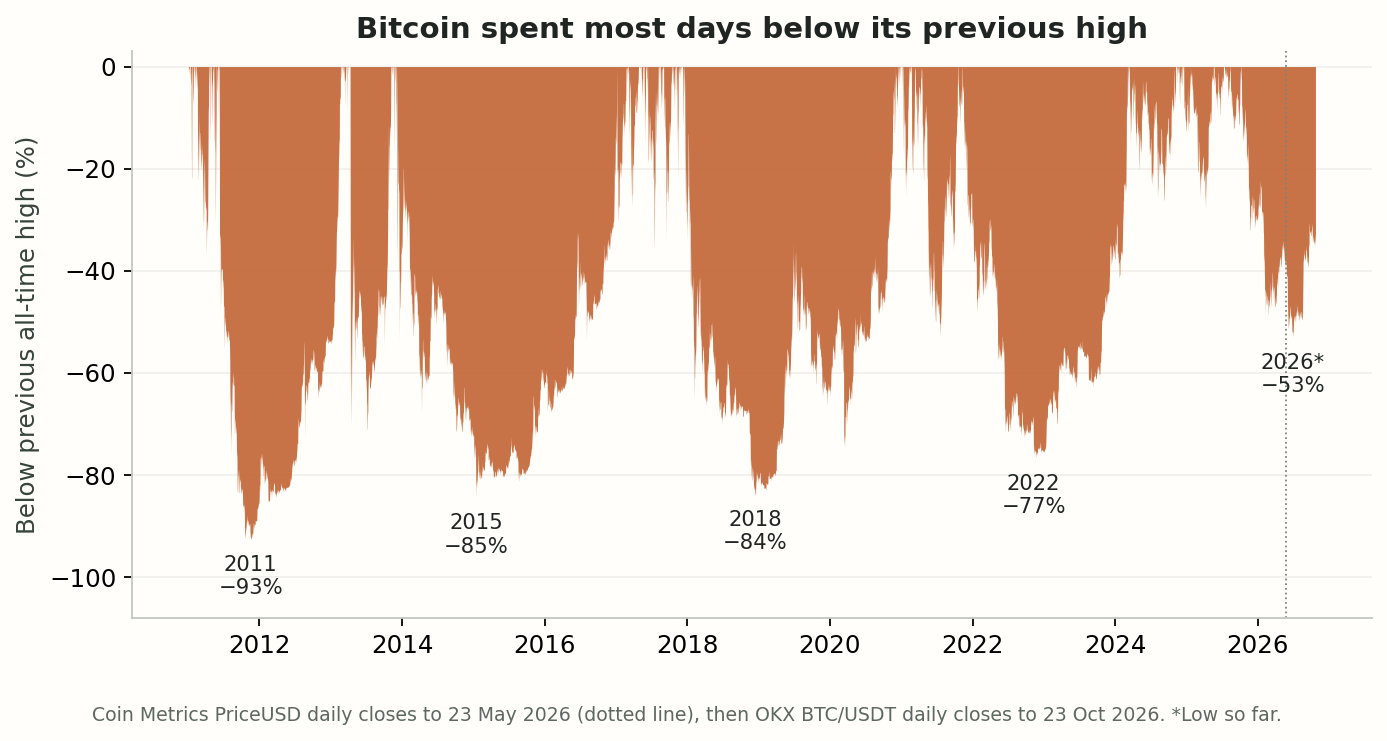
Since 2011 Bitcoin has fallen at least 50% from an all-time-high close seven times, counting the decline that began in October 2025. The six completed episodes all ended with a new all-time-high close, after 189 to 1,177 days below the old peak.
The three largest cycle declines, from the peaks of December 2013, December 2017 and November 2021, are the closest comparison for a bear market. They reached their lowest close 364 to 406 days after the peak, at −77% to −85%, and then needed another 481 to 771 days to set a new high: 847 to 1,177 days in total, roughly 2.3 to 3.2 years.
This is the record of an asset that survived. Many tokens that fell as far did not come back, which is why the altcoin comparison below matters as much as the Bitcoin table.
Smaller drops recovered in weeks, and most days are spent below a high
Falls of 20% to 50% are routine even in rising markets. Since 2016 there were eight of them that did not turn into a 50% decline: four in 2017, two in 2021, one in 2024 and one from December 2024 to April 2025. Each was back at a new high within 8 to 238 days, with a median of about 48 days.
Measured by days rather than episodes, being below the previous high is the normal state. Since 2016 Bitcoin closed at a new all-time high on 3.8% of days and was at least 20% below its previous high on 70.6% of days.
How the 2025–2026 decline compares
Bitcoin’s highest daily close was US$124,824 on 6 October 2025. Its lowest close since then was US$58,628 on 30 June 2026, 53.0% lower and 267 days after the peak. On 23 October 2026, 382 days after the peak, it closed at US$81,188, 35.0% below.
At the same distance from their peaks, the 2013, 2017 and 2021 declines stood 71.7%, 80.2% and 75.5% below, and all three were within weeks of their final lows. This decline has so far been much shallower than any of them, in line with lower day-to-day volatility since 2024. Whether the June 2026 close was the low is not known, and three earlier cycles do not set a schedule for this one.
A moderate drawdown was not a safer entry point
From days since 2016 when Bitcoin was 50–70% below its high, the price was higher one year later in 88% of cases (1,166 days). From days when it was only 20–30% below, it was higher a year later in 45% of cases (235 days), with a median one-year return of −12.3%. Many of those moderate-drawdown days were the early part of a deeper fall, in 2018 and 2022.
These day counts come from three or four cycles and overlap heavily, so they are not independent observations and should not be read as odds for the next twelve months.
Altcoins often never regained their old peak
We applied the same test to nine large altcoins with Coin Metrics histories back to 2018 or earlier. Seven of them eventually closed above their 2017–18 peak, after 468 days (BNB) to 2,565 days (XRP, almost seven years). Bitcoin Cash and Stellar never have.
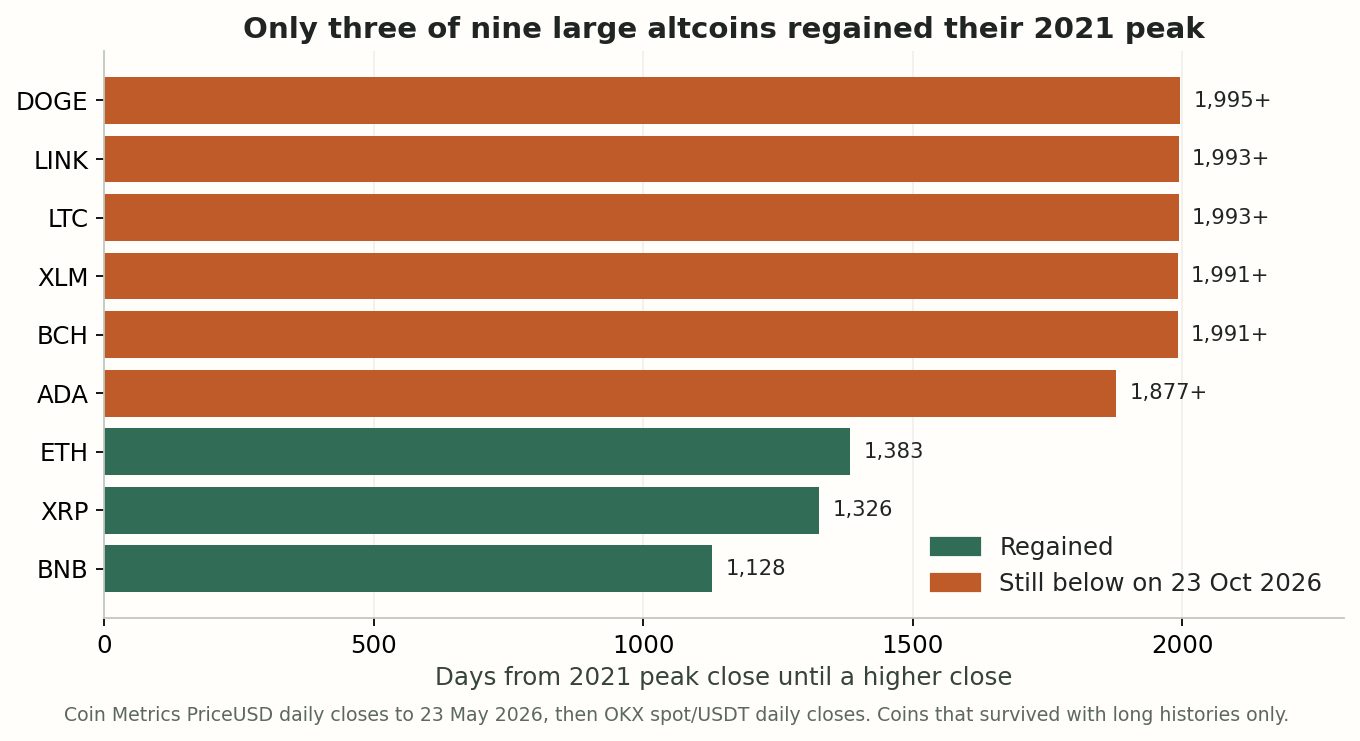
The 2021 peaks have been harder to regain. Only BNB, XRP and Ether closed above them, after 1,128 to 1,383 days. Dogecoin, Litecoin, Cardano, Chainlink, Bitcoin Cash and Stellar were still below their 2021 peaks about five years later, and 77% to 93% below their all-time highs on 23 October 2026. Every coin here survived and kept a long price history; coins that faded away are not in the sample, so the full record for altcoins is worse than this table.
How the numbers were calculated
Bitcoin prices are Coin Metrics’ PriceUSD, a UTC day-end reference rate, from 18 July 2010 to 23 May 2026, followed by OKX spot BTC/USDT daily candle closes (UTC days) to 23 October 2026. Over their last 60 overlapping days the two series differed by 0.08% on average. A drawdown is measured from the highest previous daily close; an episode ends at the first close above that peak. The same splice is used for the altcoins, whose cycle peaks are the highest closes from 1 June 2017 to 30 June 2018 and during calendar 2021.
Daily closes are lower than intraday highs and higher than intraday lows, so peaks, lows and drawdowns differ slightly from charts that use intraday prices. USDT prices are treated as US dollars after May 2026. No fees, taxes or interest are included.
Will Bitcoin go back up after a crash?
Every completed Bitcoin decline of 50% or more since 2011 ended with a new all-time high, after 189 to 1,177 days. Six completed episodes of one surviving asset are a small record; they do not guarantee the outcome or timing of the current decline.
How long does Bitcoin take to recover from a bear market?
The three largest cycle declines, from the 2013, 2017 and 2021 peaks, took 847 to 1,177 days, about 2.3 to 3.2 years, from the peak close to a new high. Smaller 20–50% drops since 2016 recovered in 8 to 238 days.
Do altcoins recover to their all-time highs?
Often not. Of nine large, long-listed altcoins, only ETH, XRP and BNB closed above their 2021 peaks; the other six were 77% to 93% below their all-time highs on 23 October 2026, about five years later.
Limitations
One surviving asset for the main record, with six completed Bitcoin declines of 50% or more, and nine surviving altcoins. Daily closes miss intraday extremes; two price sources are joined in May 2026 and USDT is treated as US dollars. Overlapping days are not independent observations. Past recoveries are not a forecast or investment advice.
Sources and data access
- Coin Metrics: public BTC daily data
- Coin Metrics: PriceUSD definition and timestamp convention
- OKX market data documentation
Cited sources document external facts or data formats; they do not endorse our findings. The public snapshot contains the table and methods. Source-file fingerprints are included for recalculated datasets. Full archived raw files are not distributed here; fingerprints identify the files used, rather than independently proving the results.
Aggregate data snapshot (JSON) · Markdown · Methods and limitations
Live prior 30-day hourly baseline — separate from the historical study
Only the current watch list is shown, up to 12 assets. Missing or stale estimates remain unavailable. Venue and quote currency are kept separate; beta needs matching BTC data. Hourly statistics are not minute-move probabilities.
Observation cutoff (UTC): 24/10/2026, 14:44
| Asset | Source | Bars / expected | Median |r| (%) | P99 |r| (%) | BTC Beta | Matched N | Last close (UTC) | Status |
|---|---|---|---|---|---|---|---|---|
| HYPE | OKX · USDT | 720/720 | 0.3477 | 1.8803 | 1.2473 | 719 | 24/10/2026, 14:00 | Ready |
| BTC | OKX · USDT | 720/720 | 0.1409 | 1.0082 | 1.0000 | 719 | 24/10/2026, 14:00 | Ready |
| SUI | OKX · USDT | 720/720 | 0.4833 | 3.5596 | 2.1580 | 719 | 24/10/2026, 14:00 | Ready |
| ONDO | OKX · USDT | 720/720 | 0.4999 | 3.9817 | 2.2199 | 719 | 24/10/2026, 14:00 | Ready |
| SOL | OKX · USDT | 720/720 | 0.2713 | 2.0082 | 1.4864 | 719 | 24/10/2026, 14:00 | Ready |
| ADA | OKX · USDT | 720/720 | 0.4336 | 2.9570 | 2.0064 | 719 | 24/10/2026, 14:00 | Ready |
| AVAX | OKX · USDT | 720/720 | 0.4243 | 2.9471 | 1.8249 | 719 | 24/10/2026, 14:00 | Ready |
| BCH | OKX · USDT | 720/720 | 0.3517 | 2.5564 | 1.5322 | 719 | 24/10/2026, 14:00 | Ready |
| BNB | OKX · USDT | 720/720 | 0.1759 | 1.0513 | 0.8796 | 719 | 24/10/2026, 14:00 | Ready |
| DOGE | OKX · USDT | 720/720 | 0.3019 | 1.9830 | 1.5494 | 719 | 24/10/2026, 14:00 | Ready |
| ETH | OKX · USDT | 720/720 | 0.1896 | 1.4105 | 1.2100 | 719 | 24/10/2026, 14:00 | Ready |
| HBAR | OKX · USDT | 720/720 | 0.4499 | 3.2265 | 1.4532 | 719 | 24/10/2026, 14:00 | Ready |
Related live archives
Related research
Altcoin beta to Bitcoin: BTC, ETH, SOL and DOGE hourly returns
Compare hourly returns, volatility and Bitcoin beta for BTC, ETH, SOL and DOGE using OKX spot data, with sample counts and a separate live baseline.
Do XRP and Solana ETF flows move the price? First-year data
US spot XRP and SOL ETFs took in US$1.8bn and US$1.5bn while both coins fell more than 40%. Daily flows barely tracked the price and did not predict the next days.
Perpetual funding rates and annualized yield: a 2025 comparison
Compare 2025 Binance perpetual funding rates for BTC, ETH, SOL and BNB. Funding-rate totals differ from account returns and guaranteed annual yield.
Bitcoin halving and bull markets: evidence from four halvings
Compare Bitcoin returns and drawdowns around four halvings. Positive one-year endpoints in this sample do not prove that halving alone causes a bull market.