Do Ethereum ETF flows move the ETH price? Two years of daily data
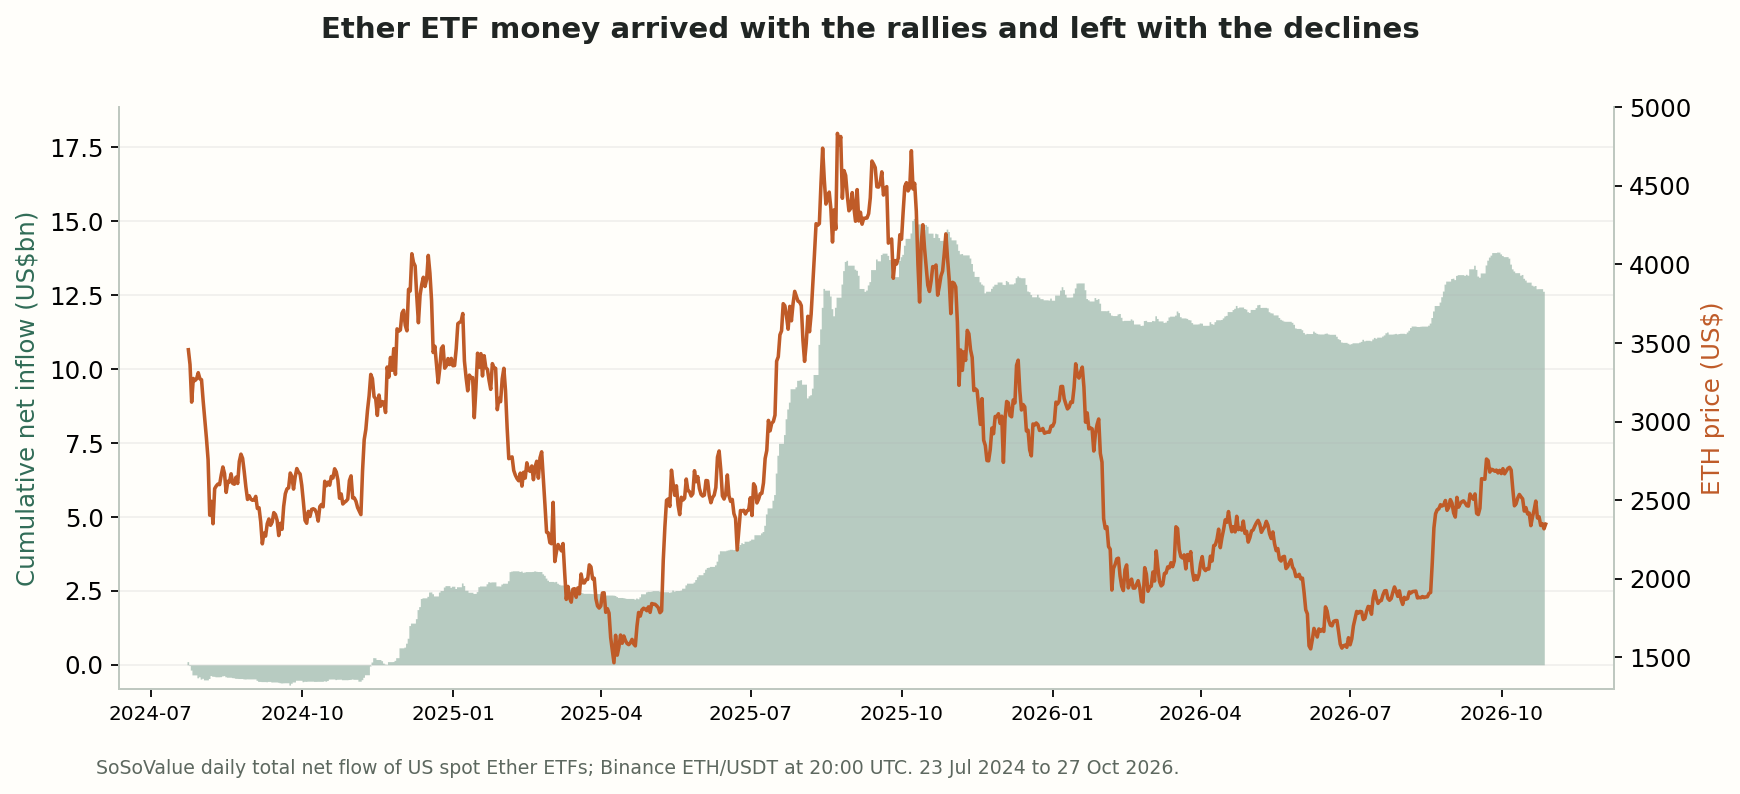
US spot Ether ETFs took in US$12.6bn net while ETH fell 32%. Flows rose and fell with the price on the same day and the days before, but did not predict the next one to three days.
Contents
- 01US$12.6 billion in, and ETH lower
- 02Flows move with the price, not ahead of it
- 03No sign that a day’s flow predicts the next one to three days
- 04How the numbers were calculated
- 05Do Ethereum ETF inflows push the ETH price up?
- 06Why is ETH down when ETF inflows were positive?
- 07Are Ethereum ETF investors in profit?
- 08Limitations
- 09Sources and data access
- 10Cite this study
- 11Related live archives
- 12Related research
| Daily flow group (fifths) | Days N | Median flow (US$m) | Same-day ETH move (bp) | Next 24h (bp) | Next 72h (bp) | Next 24h up (%) |
|---|---|---|---|---|---|---|
| Largest outflows | 114 | -96.7 | -193.7 | +0.6 | +2.6 | 52.6 |
| Outflows | 114 | -27.8 | -59.6 | +16.4 | +50.0 | 52.6 |
| Middle | 113 | +0.6 | -13.8 | -26.9 | -50.1 | 48.7 |
| Inflows | 114 | +45.4 | +100.6 | +56.1 | +39.8 | 57.9 |
| Largest inflows | 114 | +167.9 | +175.2 | -13.2 | -10.3 | 45.6 |
| All days | 569 | — | — | +6.7 | +6.5 | — |
View chart data
| Quarter | Net flow (US$m) | ETH price at quarter end (US$) |
|---|---|---|
| 2024 Q3 | -524 | 2,595 |
| 2024 Q4 | +3,181 | 3,355 |
| 2025 Q1 | -242 | 1,828 |
| 2025 Q2 | +1,795 | 2,516 |
| 2025 Q3 | +9,589 | 4,160 |
| 2025 Q4 | -1,471 | 2,971 |
| 2026 Q1 | -769 | 2,097 |
| 2026 Q2 | -714 | 1,581 |
| 2026 Q3 | +3,050 | 2,670 |
| 2026 Q4 (to 27 Oct) | -1,324 | 2,348 |
US$12.6 billion in, and ETH lower
US spot Ether ETFs began trading on 23 July 2024. By 27 October 2026, across 569 US trading days, they had taken in a net US$12.57 billion. Inflow and outflow days were nearly balanced, 286 against 271, with 12 days of exactly zero. Over the same period ETH fell 32.1%, from about US$3,457 to US$2,348, and the funds’ combined assets fell from a peak of US$32.0 billion on 6 October 2025 to US$14.2 billion.
The money came in waves. July and August 2025 alone brought US$9.3 billion, while ETH rose 85% to a record of about US$4,935 on 24 August 2025. Cumulative net inflows peaked at US$15.09 billion on 8 October 2025; since then the funds have lost a net US$2.5 billion while ETH fell 46%. Weighting each day’s inflow by that day’s price, the average inflow dollar went in at about US$3,412, 45% above the latest price.
Flows move with the price, not ahead of it
The rank correlation between a day’s flow and Ether’s move over the same 24 hours to the US close is 0.34, and with the move over the three days before that it is also 0.34. On the fifth of days with the largest outflows ETH had already fallen 1.94% on average that day; on the largest-inflow days it had risen 1.75%. Flows are reported after the US close, so by the time a reader sees a big inflow, the price move that came with it has generally happened.
The same-day link has strengthened as the funds matured: 0.13 in 2024, 0.28 in 2025 and 0.55 in 2026. For US spot Bitcoin ETFs, our earlier study found 0.44 over 2024–2026.
No sign that a day’s flow predicts the next one to three days
Once a day’s figures are public, the link disappears. Measured from 14:00 UTC the next day, the rank correlation with Ether’s next 24 hours is 0.00 and with the next 72 hours −0.00. After the largest-inflow fifth of days, ETH averaged −13 basis points over the next 24 hours, against +7 bp after any day; after the largest-outflow fifth it averaged +1 bp. The five groups do not line up in order.
Holding the same-day and previous three-day price moves constant, one standard deviation more flow was associated with +20 bp over the next 24 hours (t 1.28) and +5 bp over 72 hours (t 0.16), neither distinguishable from zero.
How the numbers were calculated
Daily flows are SoSoValue’s total net flows across all US spot Ether ETFs, in US dollars, as published on 28 October 2026, including the converted Grayscale trust. Prices are Binance ETH/USDT hourly opens. Same-day moves run from 16:00 to 16:00 New York time; forward returns start at 14:00 UTC on the next calendar day, by which time issuers’ daily figures are normally published, and run 24 or 72 hours. Correlations are Spearman rank correlations; the regression uses ordinary least squares. Period prices and the inflow-weighted average use 20:00 UTC prices on flow days.
Days overlap in the 72-hour returns, so those observations are not independent. Third-party flow tables can be revised after first publication; the fingerprint identifies the snapshot used.
Do Ethereum ETF inflows push the ETH price up?
Inflows and price rises happen together: on the largest-inflow days ETH had already risen 1.75% on average over the same day. That does not show which causes which, and a published day’s flow told us nothing about the next one to three days (rank correlation 0.00).
Why is ETH down when ETF inflows were positive?
Net inflows since launch are positive, US$12.6 billion, but most arrived in a few rallies, especially July and August 2025. Since cumulative inflows peaked in October 2025 the funds have had net outflows of US$2.5 billion while ETH fell 46%. ETF flows are also only part of Ether demand and supply.
Are Ethereum ETF investors in profit?
In aggregate, not at 27 October 2026 prices. Weighting each day’s inflow by that day’s price, the average inflow dollar went in at about US$3,412, 45% above the latest ETH price of about US$2,348. Individual holders’ results depend on when they bought and sold.
Limitations
One third-party flow series and about two and a quarter years of data, with zero-flow days that may include missing reports. Prices come from one spot venue and are measured in USDT. Publication times vary by issuer, so the entry clock is an approximation. No causal identification, fees, staking yield, spreads or account-level backtest are included; this is not trading advice.
Sources and data access
- SoSoValue: US spot Ether ETF daily flows
- Farside Investors: Ethereum ETF flow
- Binance public data and archive formats
Cited sources document external facts or data formats; they do not endorse our findings. The public snapshot contains the table and methods. Source-file fingerprints are included for recalculated datasets. Full archived raw files are not distributed here; fingerprints identify the files used, rather than independently proving the results.
Cite this study
WhyCoinMoves Research (2026). Do Ethereum ETF flows move the ETH price? Two years of daily data. Reviewed 2026-10-28. https://whycoinmoves.com/ja/research/ethereum-etf-flows-and-price
The study snapshot contains its tables, methods and available source-file fingerprints. Current event exports and their DOI describe a separate dataset.
Related live archives
Related research
Altcoin beta to Bitcoin: BTC, ETH, SOL and DOGE hourly returns
Compare hourly returns, volatility and Bitcoin beta for BTC, ETH, SOL and DOGE using OKX spot data, with sample counts.
Will Bitcoin go back up? Every crash since 2011 and its recovery time
Every Bitcoin fall of 50% or more since 2011: how long the low and the next high took, how 2025–26 compares, and which altcoins regained their old peaks.
Perpetual funding rates and annualized yield: a 2025 comparison
Compare 2025 Binance perpetual funding rates for BTC, ETH, SOL and BNB. Funding-rate totals differ from account returns and guaranteed annual yield.
Best time to trade crypto: volatility by hour and time zone
When crypto moves most and least, hour by hour, with local times for the US, UK, India, Nigeria, the Philippines and more. Five coins, OKX data 2024–2026.