Do XRP and Solana ETF flows move the price? First-year data
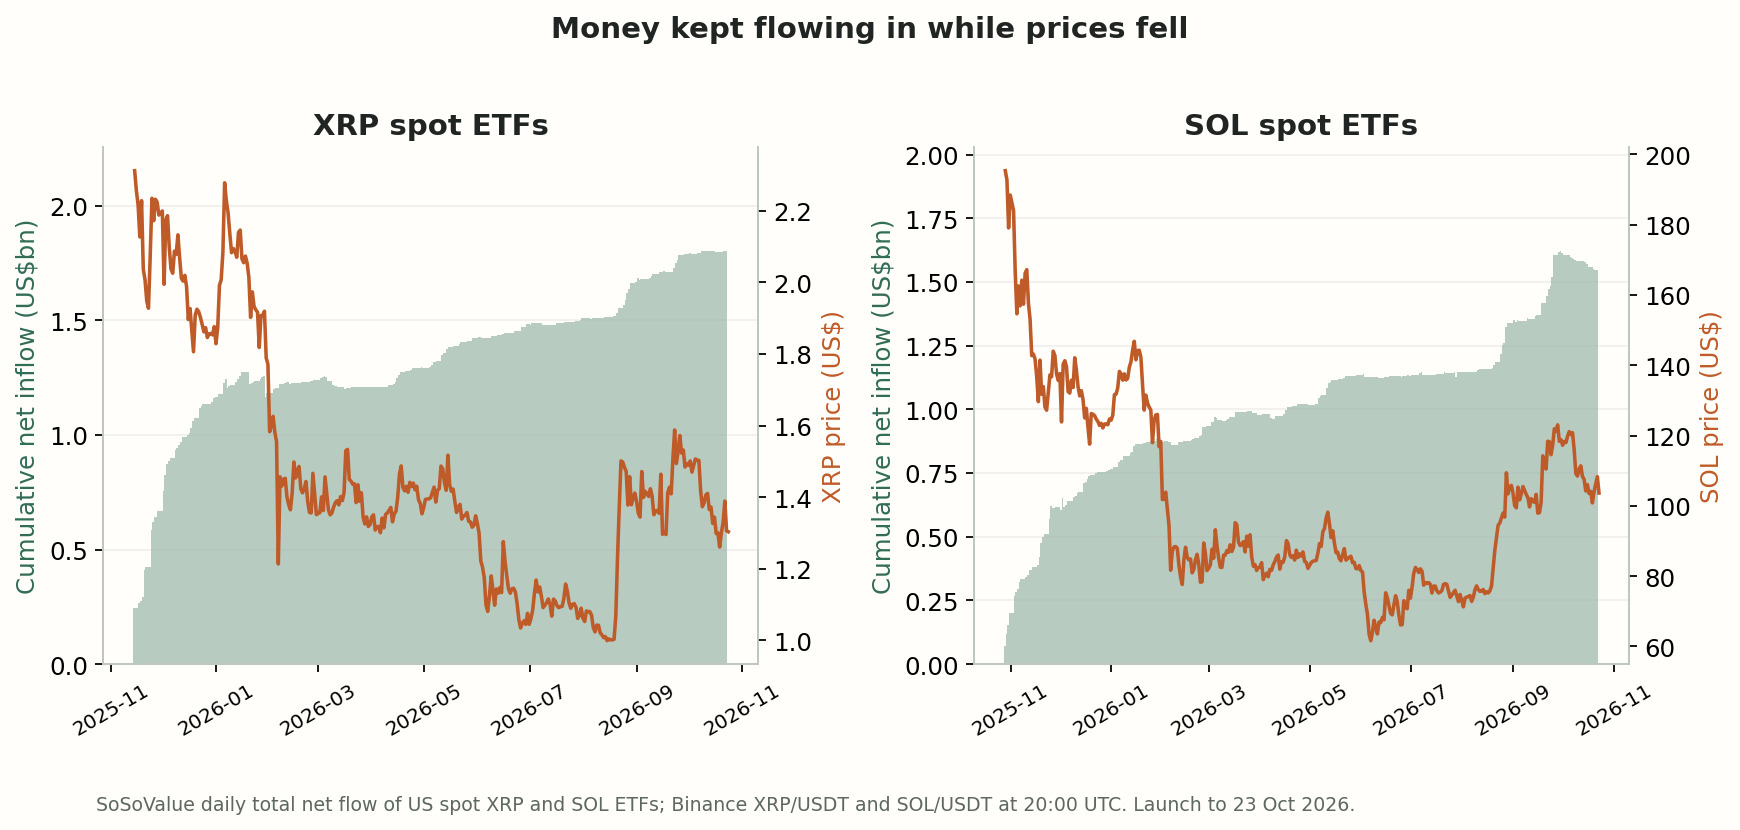
US spot XRP and SOL ETFs took in US$1.8bn and US$1.5bn while both coins fell more than 40%. Daily flows barely tracked the price and did not predict the next days.
Contents
- 01Steady inflows, falling prices
- 02Flows barely tracked the price, even on the same day
- 03No sign that a day’s flow predicts the next one to three days
- 04The August 2026 rally: flows followed the move
- 05How the numbers were calculated
- 06Do XRP ETF inflows make the XRP price go up?
- 07Did Solana ETF flows move the SOL price?
- 08Are XRP and Solana ETF investors in profit?
- 09Limitations
- 10Sources and data access
- 11Live prior 30-day hourly baseline — separate from the historical study
- 12Related live archives
- 13Related research
| Measure | XRP ETFs | SOL ETFs | BTC ETFs (2024–2026) |
|---|---|---|---|
| First flow day | 2025-11-14 | 2025-10-28 | 2024-01-11 |
| US trading days N | 235 | 248 | 684 |
| Cumulative net flow (US$m) | +1,804 | +1,540 | about +57,900 |
| Days with inflow / outflow / zero | 148 / 27 / 60 | 159 / 52 / 37 | — |
| Price change, first to last flow day (%) | -43.6 | -46.9 | — |
| Last price vs inflow-weighted average price (%) | -29.9 | -17.8 | — |
| Flow vs same-day price move | 0.11 | 0.12 | 0.44 |
| Flow vs next-24h move | -0.02 | 0.01 | 0.01 |
| Flow vs next-72h move | -0.16 | -0.03 | 0.01 |
View chart data
| Month | XRP ETF net flow (US$m) | SOL ETF net flow (US$m) | XRP price (US$) | SOL price (US$) |
|---|---|---|---|---|
| 2025-10 | — | +199.2 | — | 188.4 |
| 2025-11 | +666.6 | +419.4 | 2.20 | 137.6 |
| 2025-12 | +499.9 | +147.6 | 1.83 | 124.4 |
| 2026-01 | +15.6 | +104.7 | 1.58 | 101.8 |
| 2026-02 | +58.1 | +63.0 | 1.35 | 82.2 |
| 2026-03 | -31.2 | +45.4 | 1.34 | 82.7 |
| 2026-04 | +81.6 | +38.7 | 1.37 | 83.0 |
| 2026-05 | +131.9 | +115.3 | 1.33 | 81.6 |
| 2026-06 | +59.5 | -0.8 | 1.04 | 73.7 |
| 2026-07 | +27.3 | +14.6 | 1.06 | 73.1 |
| 2026-08 | +159.2 | +193.5 | 1.39 | 103.6 |
| 2026-09 | +121.4 | +271.6 | 1.49 | 117.2 |
| 2026-10 (to 23 Oct) | +14.5 | -72.2 | 1.30 | 103.6 |
Steady inflows, falling prices
US spot Solana ETFs began trading on 28 October 2025 and spot XRP ETFs on 13 November 2025, with the first XRP net flow recorded the next day. By 23 October 2026 they had taken in a net US$1.54 billion and US$1.80 billion. Outflow days were rare: 27 of 235 trading days for XRP and 52 of 248 for SOL.
Over the same period XRP fell 43.6%, from US$2.31 to US$1.30, and SOL fell 46.9%, from US$195 to US$104. Most of the money arrived early: XRP funds took in US$667 million in their first ten trading days, 37% of the total to date, while XRP fell 5.4%; SOL funds took in US$343 million in theirs while SOL fell 14.4%. Weighting each day’s inflow by that day’s price, the average dollar went into XRP at about US$1.86 and into SOL at about US$126, 29.9% and 17.8% above the latest prices.
Flows barely tracked the price, even on the same day
For US spot Bitcoin ETFs, the rank correlation between a day’s flow and Bitcoin’s move over the same 24 hours to the US close was 0.44. For XRP and SOL funds it was only 0.11 and 0.12. SOL flows tracked the price over the previous three days a little more closely (0.16), consistent with buyers responding to rises already seen.
Size explains much of the difference. The median day’s net flow, in either direction, was US$3.9 million for XRP funds and US$3.1 million for SOL funds: about 2.5% and 1.1% of the same day’s trading in the Binance XRP/USDT and SOL/USDT pairs alone, which are only part of the spot market. Flows of that size are small next to the rest of the market’s trading.
No sign that a day’s flow predicts the next one to three days
Once a day’s figures are published, the link to what follows is absent or slightly negative. Measured from 14:00 UTC the next day, the rank correlation with the next 24 hours was −0.02 for XRP and 0.01 for SOL, and with the next 72 hours −0.16 and −0.03. After the fifth of days with the largest XRP inflows (median US$19 million), XRP averaged −55 basis points over the next 24 hours and −106 bp over 72 hours, against −15 bp and +1 bp after any day. For SOL the largest-inflow fifth was followed by −62 bp and −70 bp, against −7 bp and −13 bp.
Holding the same-day and previous three-day price moves constant, one standard deviation more flow was associated with −14 bp over the next 24 hours for both coins (t −0.63 and −0.62), indistinguishable from zero. The negative 72-hour reading for XRP should not be read as a signal either: the 72-hour windows overlap, which overstates its significance, and the sample is less than a year.
The August 2026 rally: flows followed the move
The largest monthly inflows since launch were in August and September 2026: US$281 million into XRP funds and US$465 million into SOL funds over the two months. Both coins had started rallying in mid-August, and the heaviest inflow days arrived during and after the rise rather than before it. In October, as prices slipped back, SOL funds recorded net outflows of US$72 million.
How the numbers were calculated
Daily flows are SoSoValue’s total net flows across all US spot XRP and SOL ETFs, in US dollars, as published on 24 October 2026. Days on which the series shows exactly zero are kept; they include days with no creations or redemptions and possibly days without a report. Flow providers can differ slightly: on 22 October 2026 Farside showed −US$8.9 million for SOL funds against SoSoValue’s −US$8.5 million.
Prices are Binance XRP/USDT and SOL/USDT hourly opens. Same-day moves run from 16:00 to 16:00 New York time; forward returns start at 14:00 UTC on the next calendar day and run 24 or 72 hours. Correlations are Spearman rank correlations; the regression uses ordinary least squares. Period prices and the inflow-weighted average use 20:00 UTC prices on flow days. The Bitcoin comparison figures come from our Bitcoin ETF study, which uses Farside flows from January 2024 to October 2026.
Do XRP ETF inflows make the XRP price go up?
Not on the first year of data. XRP ETFs took in a net US$1.8 billion while XRP fell 43.6%, a day’s flow was only weakly related to that day’s price move (rank correlation 0.11), and published flows did not predict the next 24 or 72 hours.
Did Solana ETF flows move the SOL price?
Not detectably. SOL ETFs took in a net US$1.5 billion while SOL fell 46.9%. Flows tended to follow recent price rises rather than lead them, and the correlation with SOL’s next-day move was 0.01.
Are XRP and Solana ETF investors in profit?
In aggregate, not at 23 October 2026 prices. Weighting each day’s inflow by that day’s price, the average dollar went into XRP at about US$1.86 and into SOL at about US$126, 29.9% and 17.8% above the latest prices. Individual holders’ results depend on when they bought and sold.
Limitations
Less than a year of data for each fund group, from one third-party flow series, with zero-flow days that may include missing reports. Prices come from one spot venue and are measured in USDT. Publication times vary by issuer, so the entry clock is an approximation. No causal identification, fees, staking yield, spreads or account-level backtest are included; this is not trading advice.
Sources and data access
- SoSoValue: US spot XRP ETF daily flows
- SoSoValue: US spot SOL ETF daily flows
- Farside Investors: Solana ETF flow
- Binance public data and archive formats
Cited sources document external facts or data formats; they do not endorse our findings. The public snapshot contains the table and methods. Source-file fingerprints are included for recalculated datasets. Full archived raw files are not distributed here; fingerprints identify the files used, rather than independently proving the results.
Aggregate data snapshot (JSON) · Markdown · Methods and limitations
Live prior 30-day hourly baseline — separate from the historical study
Only the current watch list is shown, up to 12 assets. Missing or stale estimates remain unavailable. Venue and quote currency are kept separate; beta needs matching BTC data. Hourly statistics are not minute-move probabilities.
Observation cutoff (UTC): 24/10/2026, 14:46
| Asset | Source | Bars / expected | Median |r| (%) | P99 |r| (%) | BTC Beta | Matched N | Last close (UTC) | Status |
|---|---|---|---|---|---|---|---|---|
| HYPE | OKX · USDT | 720/720 | 0.3477 | 1.8803 | 1.2473 | 719 | 24/10/2026, 14:00 | Ready |
| BTC | OKX · USDT | 720/720 | 0.1409 | 1.0082 | 1.0000 | 719 | 24/10/2026, 14:00 | Ready |
| SUI | OKX · USDT | 720/720 | 0.4833 | 3.5596 | 2.1580 | 719 | 24/10/2026, 14:00 | Ready |
| ONDO | OKX · USDT | 720/720 | 0.4999 | 3.9817 | 2.2199 | 719 | 24/10/2026, 14:00 | Ready |
| SOL | OKX · USDT | 720/720 | 0.2713 | 2.0082 | 1.4864 | 719 | 24/10/2026, 14:00 | Ready |
| ADA | OKX · USDT | 720/720 | 0.4336 | 2.9570 | 2.0064 | 719 | 24/10/2026, 14:00 | Ready |
| AVAX | OKX · USDT | 720/720 | 0.4243 | 2.9471 | 1.8249 | 719 | 24/10/2026, 14:00 | Ready |
| BCH | OKX · USDT | 720/720 | 0.3517 | 2.5564 | 1.5322 | 719 | 24/10/2026, 14:00 | Ready |
| BNB | OKX · USDT | 720/720 | 0.1759 | 1.0513 | 0.8796 | 719 | 24/10/2026, 14:00 | Ready |
| DOGE | OKX · USDT | 720/720 | 0.3019 | 1.9830 | 1.5494 | 719 | 24/10/2026, 14:00 | Ready |
| ETH | OKX · USDT | 720/720 | 0.1896 | 1.4105 | 1.2100 | 719 | 24/10/2026, 14:00 | Ready |
| HBAR | OKX · USDT | 720/720 | 0.4499 | 3.2265 | 1.4532 | 719 | 24/10/2026, 14:00 | Ready |
Related live archives
Related research
Altcoin beta to Bitcoin: BTC, ETH, SOL and DOGE hourly returns
Compare hourly returns, volatility and Bitcoin beta for BTC, ETH, SOL and DOGE using OKX spot data, with sample counts and a separate live baseline.
Will Bitcoin go back up? Every crash since 2011 and its recovery time
Every Bitcoin fall of 50% or more since 2011: how long the low and the next high took, how 2025–26 compares, and which altcoins regained their old peaks.
Perpetual funding rates and annualized yield: a 2025 comparison
Compare 2025 Binance perpetual funding rates for BTC, ETH, SOL and BNB. Funding-rate totals differ from account returns and guaranteed annual yield.
Best time to trade crypto: volatility by hour and time zone
When crypto moves most and least, hour by hour, with local times for the US, UK, India, Nigeria, the Philippines and more. Five coins, OKX data 2024–2026.