Best time to trade crypto: volatility by hour and time zone
When crypto moves most and least, hour by hour, with local times for the US, UK, India, Nigeria, the Philippines and more. Five coins, OKX data 2024–2026.
Contents
- 01Crypto trades around the clock, but it moves on New York time
- 02The busiest and quietest hours in your time zone
- 03Weekends are quieter, not closed
- 04No hour of the day reliably goes up
- 05Is the pattern stable?
- 06How the numbers were calculated
- 07What is the best time of day to trade crypto?
- 08Does crypto trade 24/7, including weekends?
- 09What time does the crypto daily candle close?
- 10Limitations
- 11Sources and data access
- 12Live prior 30-day hourly baseline — separate from the historical study
- 13Related live archives
- 14Related research
| Region | Busiest 4 hours (local) | Quietest 4 hours (local) | US stock market opens (local) | Daily candle close, 00:00 UTC (local) |
|---|---|---|---|---|
| US Eastern (New York, Toronto) | 09:00–13:00 | 23:00–03:00 | 09:30 | 20:00 / 19:00 |
| US Pacific | 06:00–10:00 | 20:00–00:00 | 06:30 | 17:00 / 16:00 |
| UK (London) | 14:00–18:00 | 04:00–08:00 | 14:30 | 01:00 / 00:00 |
| Nigeria (Lagos) | 14:00–18:00 | 05:00–09:00 | 14:30 / 15:30 | 01:00 |
| South Africa | 15:00–19:00 | 06:00–10:00 | 15:30 / 16:30 | 02:00 |
| Kenya (Nairobi) | 16:00–20:00 | 07:00–11:00 | 16:30 / 17:30 | 03:00 |
| UAE (Dubai) | 17:00–21:00 | 08:00–12:00 | 17:30 / 18:30 | 04:00 |
| Pakistan | 18:00–22:00 | 09:00–13:00 | 18:30 / 19:30 | 05:00 |
| India | 18:30–22:30 | 09:30–13:30 | 19:00 / 20:00 | 05:30 |
| Philippines / Malaysia / Singapore | 21:00–01:00 | 12:00–16:00 | 21:30 / 22:30 | 08:00 |
| China / Hong Kong | 21:00–01:00 | 12:00–16:00 | 21:30 / 22:30 | 08:00 |
| Korea / Japan | 22:00–02:00 | 13:00–17:00 | 22:30 / 23:30 | 09:00 |
| Australia (Sydney) | 00:00–04:00 | 18:00–22:00 | 23:30 / 01:30 | 10:00 / 11:00 |
View chart data
| Hour starting (UTC) | Weekday move (×) | Weekend move (×) | Weekday volume (×) | Weekend volume (×) |
|---|---|---|---|---|
| 00:00 | 1.16 | 0.76 | 0.96 | 1.04 |
| 01:00 | 1.20 | 0.86 | 0.98 | 1.02 |
| 02:00 | 1.06 | 0.76 | 0.91 | 0.95 |
| 03:00 | 0.96 | 0.66 | 0.84 | 0.88 |
| 04:00 | 0.86 | 0.72 | 0.76 | 0.86 |
| 05:00 | 0.92 | 0.69 | 0.78 | 0.87 |
| 06:00 | 0.91 | 0.65 | 0.83 | 0.85 |
| 07:00 | 0.93 | 0.64 | 1.00 | 1.06 |
| 08:00 | 0.99 | 0.73 | 0.98 | 0.99 |
| 09:00 | 0.91 | 0.66 | 0.88 | 0.97 |
| 10:00 | 0.87 | 0.61 | 0.82 | 0.92 |
| 11:00 | 0.87 | 0.68 | 0.83 | 0.88 |
| 12:00 | 1.04 | 0.70 | 1.11 | 0.95 |
| 13:00 | 1.41 | 0.87 | 1.46 | 1.18 |
| 14:00 | 1.71 | 0.90 | 1.82 | 1.34 |
| 15:00 | 1.61 | 0.87 | 1.70 | 1.25 |
| 16:00 | 1.28 | 0.91 | 1.38 | 1.31 |
| 17:00 | 1.31 | 0.87 | 1.13 | 1.04 |
| 18:00 | 1.20 | 0.74 | 1.00 | 0.91 |
| 19:00 | 1.13 | 0.80 | 0.93 | 0.75 |
| 20:00 | 1.08 | 0.80 | 0.85 | 0.78 |
| 21:00 | 1.00 | 0.89 | 0.71 | 0.87 |
| 22:00 | 0.96 | 0.99 | 0.69 | 1.13 |
| 23:00 | 0.79 | 0.87 | 0.65 | 1.22 |
Crypto trades around the clock, but it moves on New York time
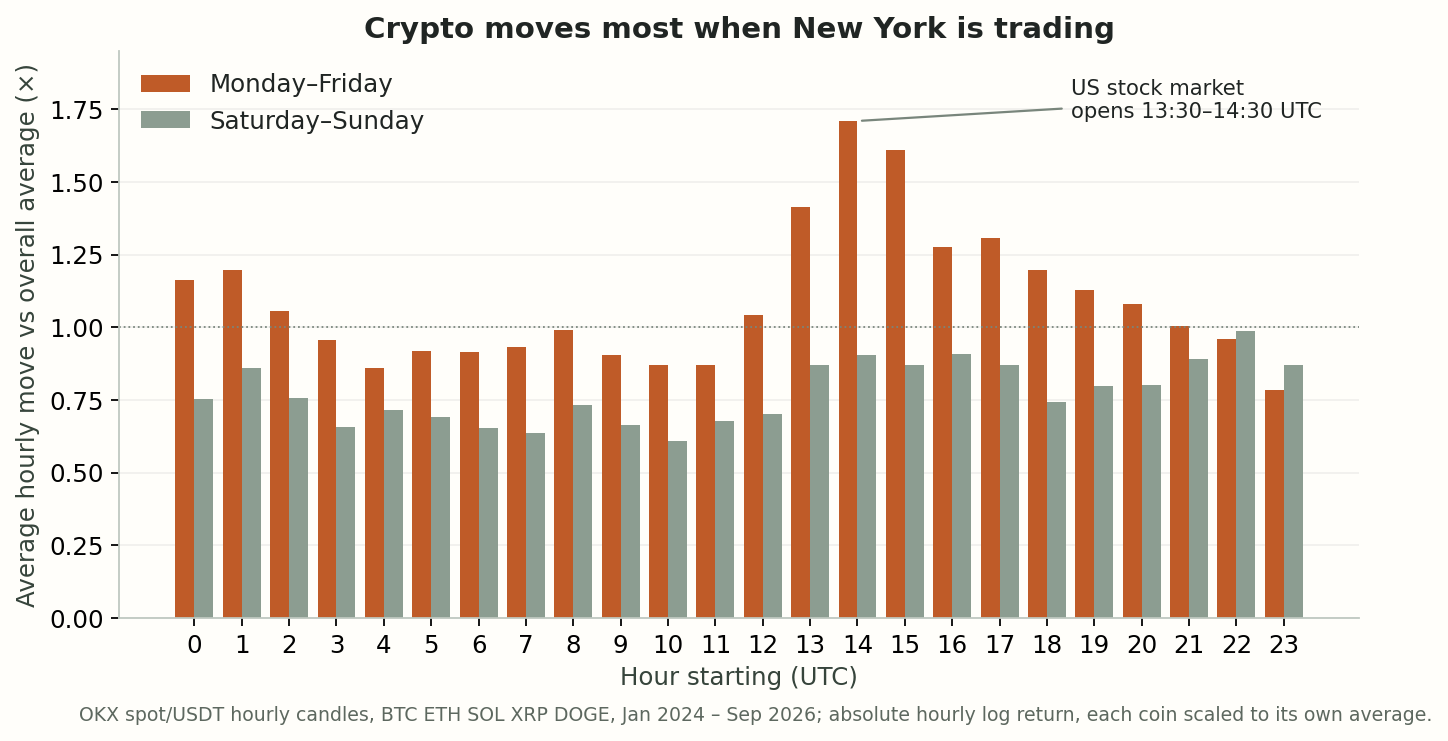
Spot crypto markets never close, yet activity is far from even across the day. Across BTC, ETH, SOL, XRP and DOGE on weekdays from January 2024 to September 2026, the average hourly price move peaked in the hour starting 14:00 UTC at 1.71 times its overall average, and the four hours from 13:00 to 17:00 UTC were all at least 1.28 times. Trading volume was concentrated in the same hours: the 14:00 UTC hour traded 1.82 times an average hour of the same day.
Those hours are the US morning. Measured in New York local time, the peak is the hour from 10:00 to 11:00 a.m., at 1.80 times average, which is sharper than the peak measured in UTC because the busy period moves with US daylight saving. The quietest weekday hours run from the US late evening into the Asian working day: 23:00 UTC averaged 0.79 times, and 04:00 to 12:00 UTC stayed between 0.86 and 0.99 times.
The busiest and quietest hours in your time zone
The table converts the busiest and quietest four-hour weekday windows into local time. They fall at 9 a.m. to 1 p.m. in New York, 2 to 6 p.m. in London and Lagos, 6 to 10 p.m. in Pakistan, about 6:30 to 10:30 p.m. in India, 9 p.m. to 1 a.m. in Manila, Kuala Lumpur, Singapore and Hong Kong, and around midnight to 4 a.m. in Sydney.
Where clocks do not change, the busy window moves one hour later when US clocks go back in November and earlier again in March. In India, for example, the US stock market opens at 7:00 p.m. during US summer time and 8:00 p.m. in winter. A second, smaller rise comes at 00:00 to 02:00 UTC (1.16 to 1.20 times), around the daily candle close and the start of the Asian morning.
Weekends are quieter, not closed
Bitcoin’s average weekend daily volume was 49% of a weekday’s, and its average hourly move was 41% smaller. The weekend drop was smaller for the other coins: daily volume was 59% of weekdays for ETH, 67–68% for XRP and SOL and 76% for DOGE. The US-morning peak largely disappears on Saturdays and Sundays; no weekend hour averaged more than 0.99 times the overall level.
Lower activity also means thinner markets, so weekend moves can still be sharp when news arrives. Our CME gap study looks at what happened when weekend moves met the reopening of regulated futures.
No hour of the day reliably goes up
Timing volatility is not the same as timing direction. Bitcoin’s average return in each UTC hour ranged from −2.7 to +3.7 basis points (hundredths of a percent). The hour starting 21:00 UTC averaged +3.7 bp (t 2.44) and the hour starting 23:00 UTC −2.7 bp (t −2.11); both kept their sign in each of 2024, 2025 and 2026.
With 24 hours tested, one or two results of that size are expected by chance, and both are far below the cost of a round trip at typical taker fees of around 0.1% per side. The useful pattern is when markets are active, not which way they move.
Is the pattern stable?
The peak hour was the same in April 2022 to December 2023: 10:00 to 11:00 a.m. New York time. It was less pronounced, at 1.31 times average against 1.80 times since 2024. US trading hours have become more dominant since US spot Bitcoin ETFs began trading in January 2024, although these data cannot show that the ETFs caused the change.
How the numbers were calculated
We used confirmed OKX spot USDT hourly candles for BTC, ETH, SOL, XRP and DOGE from 1 January 2024 to 23 September 2026, keeping only UTC days with all 24 candles (994 days per coin). An hour’s move is its absolute log return, divided by that coin’s average over the whole period; an hour’s volume is base volume times the closing price, divided by the average hour of the same day. Each coin is averaged by hour first, then the five coins are weighted equally.
Local windows convert every candle to local time with the relevant daylight-saving rules and pick the four consecutive weekday hours with the highest and lowest average move. In half-hour time zones such as India, a UTC candle starts at half past the local hour. Spreads, order-book depth and fees were not measured directly.
What is the best time of day to trade crypto?
For the most movement and volume, weekday US morning hours: 9 a.m. to 1 p.m. in New York (13:00–17:00 UTC in US summer, an hour later in winter), roughly 2–6 p.m. in London and Lagos and 6:30–10:30 p.m. in India. No hour had a reliable upward or downward bias after trading costs.
Does crypto trade 24/7, including weekends?
Yes. Spot crypto markets do not close on weekends or holidays. Activity is lower, though: Bitcoin’s weekend daily volume averaged 49% of a weekday’s, and its average hourly price move was 41% smaller.
What time does the crypto daily candle close?
Most exchanges and charts close the daily candle at 00:00 UTC: 8 p.m. in New York (7 p.m. in winter), 1 a.m. in London in summer (midnight in winter), 5:30 a.m. in India and 8 a.m. in Manila, Singapore and Hong Kong.
Limitations
Five large coins on one exchange, spot candles, January 2024 to September 2026. Hourly candles miss timing within the hour, and local windows average US summer and winter time. Spreads, depth and fees were not measured directly. Activity patterns can change and are not trading advice.
Sources and data access
Cited sources document external facts or data formats; they do not endorse our findings. The public snapshot contains the table and methods. Source-file fingerprints are included for recalculated datasets. Full archived raw files are not distributed here; fingerprints identify the files used, rather than independently proving the results.
Aggregate data snapshot (JSON) · Markdown · Methods and limitations
Live prior 30-day hourly baseline — separate from the historical study
Only the current watch list is shown, up to 12 assets. Missing or stale estimates remain unavailable. Venue and quote currency are kept separate; beta needs matching BTC data. Hourly statistics are not minute-move probabilities.
Observation cutoff (UTC): 24/10/2026, 15:53
| Asset | Source | Bars / expected | Median |r| (%) | P99 |r| (%) | BTC Beta | Matched N | Last close (UTC) | Status |
|---|---|---|---|---|---|---|---|---|
| BTC | OKX · USDT | 720/720 | 0.1409 | 1.0082 | 1.0000 | 719 | 24/10/2026, 15:00 | Ready |
| HYPE | OKX · USDT | 720/720 | 0.3477 | 1.8803 | 1.2391 | 719 | 24/10/2026, 15:00 | Ready |
| ZEC | OKX · USDT | 720/720 | 0.5432 | 4.0682 | 2.2811 | 719 | 24/10/2026, 15:00 | Ready |
| SUI | OKX · USDT | 720/720 | 0.4833 | 3.5596 | 2.1690 | 719 | 24/10/2026, 15:00 | Ready |
| ONDO | OKX · USDT | 720/720 | 0.4999 | 3.9817 | 2.2012 | 719 | 24/10/2026, 15:00 | Ready |
| SOL | OKX · USDT | 720/720 | 0.2713 | 2.0082 | 1.4853 | 719 | 24/10/2026, 15:00 | Ready |
| ADA | OKX · USDT | 720/720 | 0.4336 | 2.9570 | 2.0101 | 719 | 24/10/2026, 15:00 | Ready |
| AVAX | OKX · USDT | 720/720 | 0.4243 | 2.9471 | 1.8254 | 719 | 24/10/2026, 15:00 | Ready |
| BCH | OKX · USDT | 720/720 | 0.3521 | 2.5564 | 1.5484 | 719 | 24/10/2026, 15:00 | Ready |
| BNB | OKX · USDT | 720/720 | 0.1759 | 1.0513 | 0.8846 | 719 | 24/10/2026, 15:00 | Ready |
| DOGE | OKX · USDT | 720/720 | 0.3019 | 1.9830 | 1.5542 | 719 | 24/10/2026, 15:00 | Ready |
| ETH | OKX · USDT | 720/720 | 0.1896 | 1.4105 | 1.2140 | 719 | 24/10/2026, 15:00 | Ready |
Related live archives
Related research
Altcoin beta to Bitcoin: BTC, ETH, SOL and DOGE hourly returns
Compare hourly returns, volatility and Bitcoin beta for BTC, ETH, SOL and DOGE using OKX spot data, with sample counts and a separate live baseline.
Will Bitcoin go back up? Every crash since 2011 and its recovery time
Every Bitcoin fall of 50% or more since 2011: how long the low and the next high took, how 2025–26 compares, and which altcoins regained their old peaks.
Do XRP and Solana ETF flows move the price? First-year data
US spot XRP and SOL ETFs took in US$1.8bn and US$1.5bn while both coins fell more than 40%. Daily flows barely tracked the price and did not predict the next days.
Perpetual funding rates and annualized yield: a 2025 comparison
Compare 2025 Binance perpetual funding rates for BTC, ETH, SOL and BNB. Funding-rate totals differ from account returns and guaranteed annual yield.