Bitcoin institutional adoption: CME, spot ETFs and SPY correlation
Research Bitcoin institutional access, CME futures, spot ETFs, BTC–SPY correlation and trading-hour activity, with historical data and explicit causal limits.
Contents
- 01A history of access, not a handover from retail to institutions
- 02Three documented milestones, with precise meanings
- 03Risk changed, but “mature” does not mean low-risk
- 04Cross-market association increased in this sample
- 05The recent clock-bucket test does not show a sharp US-session shift
- 06Methods, coverage and the limits of comparison
- 07What would actually measure institutional participation?
- 08Three forward scenarios and what could falsify them
- 09When did institutions start entering the Bitcoin market?
- 10Did spot Bitcoin ETFs make BTC move like the stock market?
- 11Limitations
- 12Sources and data access
- 13Live prior 30-day hourly baseline — separate from the historical study
- 14Related live archives
- 15Related research
| Period | Daily returns N | Annualised volatility (%) | P99 absolute daily return (%) | Within-period max drawdown (%) | BTC–SPY correlation | Matched intervals N |
|---|---|---|---|---|---|---|
| 2011-01-01–2017-12-17 | 2543 | 106.26 | 24.60 | -92.75 | 0.033 | 1752 |
| 2017-12-18–2019-12-31 | 744 | 78.44 | 13.32 | -83.22 | 0.010 | 512 |
| 2020-01-01–2024-01-09 | 1470 | 66.47 | 10.99 | -76.67 | 0.388 | 1012 |
| 2024-01-10–2025-12-31 | 722 | 47.48 | 8.34 | -32.08 | 0.363 | 496 |
View chart data
| Date | Documented milestone |
|---|---|
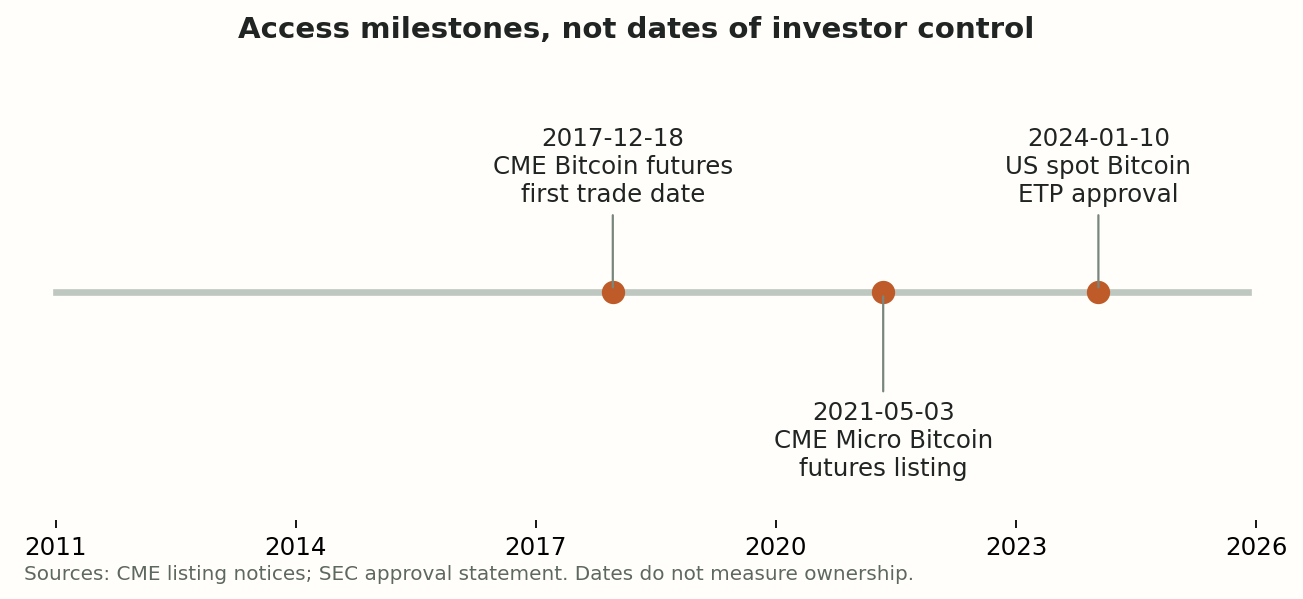
| 2017-12-18 | CME Bitcoin futures first trade date / CME 比特币期货首个交易日 |
| 2021-05-03 | CME Micro Bitcoin futures listing / CME 微型比特币期货上市 |
| 2024-01-10 | US spot Bitcoin ETP approval / 美国现货比特币 ETP 获批 |
View chart data
| Year | Daily returns N | Annualised volatility (%) |
|---|---|---|
| 2011 | 365 | 175.03 |
| 2012 | 366 | 78.01 |
| 2013 | 365 | 143.78 |
| 2014 | 365 | 73.02 |
| 2015 | 365 | 69.28 |
| 2016 | 366 | 49.66 |
| 2017 | 365 | 93.72 |
| 2018 | 365 | 82.96 |
| 2019 | 365 | 70.75 |
| 2020 | 366 | 73.64 |
| 2021 | 365 | 78.80 |
| 2022 | 365 | 63.77 |
| 2023 | 365 | 43.73 |
| 2024 | 366 | 52.93 |
| 2025 | 365 | 41.92 |
View chart data
| Year | Matched intervals N | Pearson correlation |
|---|---|---|
| 2011 | 252 | 0.100 |
| 2012 | 250 | 0.093 |
| 2013 | 252 | -0.099 |
| 2014 | 252 | -0.039 |
| 2015 | 252 | 0.050 |
| 2016 | 252 | -0.035 |
| 2017 | 251 | 0.057 |
| 2018 | 251 | 0.087 |
| 2019 | 252 | -0.125 |
| 2020 | 253 | 0.439 |
| 2021 | 252 | 0.253 |
| 2022 | 251 | 0.576 |
| 2023 | 250 | 0.159 |
| 2024 | 252 | 0.357 |
| 2025 | 250 | 0.423 |
View chart data
| Sample | Hours N | NY weekend hours (%) | NY weekend volume (%) | NY weekday bucket hours (%) | NY weekday bucket volume (%) |
|---|---|---|---|---|---|
| 2022–2023 | 15456 | 28.57 | 17.63 | 17.86 | 28.71 |
| 2024–2025 | 17520 | 28.52 | 17.78 | 17.88 | 28.91 |
A history of access, not a handover from retail to institutions
“Retail before a particular year, institutional afterwards” is an attractive but unproven summary. A product’s availability tells us who could gain access through that channel, not who owned most coins or set the marginal price. The same person can use a native exchange, a brokerage product and a hedge at once; an institutional manager can also represent retail clients.
We use four descriptive periods: an early sample before CME’s launch; the first regulated-futures period; a 2020-to-early-2024 cross-market comparison; and the period beginning with US spot ETP approval. Their boundaries are editorial choices anchored to public events or calendar periods. They were not estimated as statistical breaks, and each contains heterogeneous market conditions.
Three documented milestones, with precise meanings
CME’s Bitcoin futures began trading in the 17 December 2017 evening session for a first trade date of 18 December. The contracts provided a cash-settled regulated derivative, not ownership of spot coins by every futures trader. CME subsequently listed Micro Bitcoin futures on 3 May 2021. Smaller contracts broaden the available product set; their existence does not identify the nationality or ultimate beneficial owner of a position.
On 10 January 2024, the SEC approved listing and trading of multiple US spot Bitcoin ETP shares. That is an approval milestone, not a claim that every product started trading at that instant or that the SEC endorsed Bitcoin. Brokerage distribution and fund structures can change access, custody and portfolio workflows without proving an immediate change in market control.
Risk changed, but “mature” does not mean low-risk
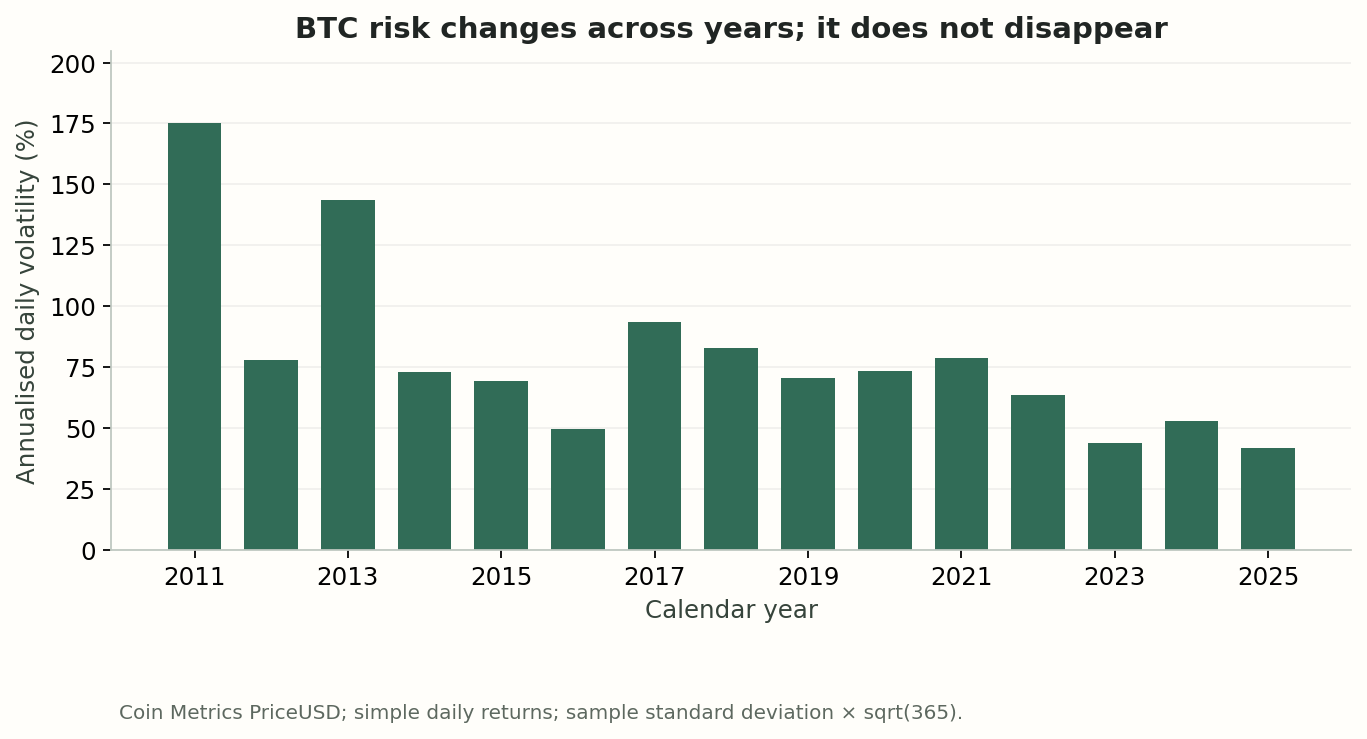
In the recalculated daily sample, pooled annualised volatility is 106.26% before the CME boundary and 47.48% in the final period. P99 absolute daily returns are 24.60% and 8.34%, respectively. The annual chart shows that the path is not a steady decline. Early markets also differ in size, venue coverage and data quality, so this is not a clean institutionalisation experiment.
The last period still has a within-period closing-price drawdown of 32.08%. Its shorter length and particular market path limit comparison with older periods. Each drawdown resets its running high at the start of the displayed segment; it is not the drawdown from Bitcoin’s all-time high or a realised investor loss. Daily closes can miss larger intraday stress.
Cross-market association increased in this sample
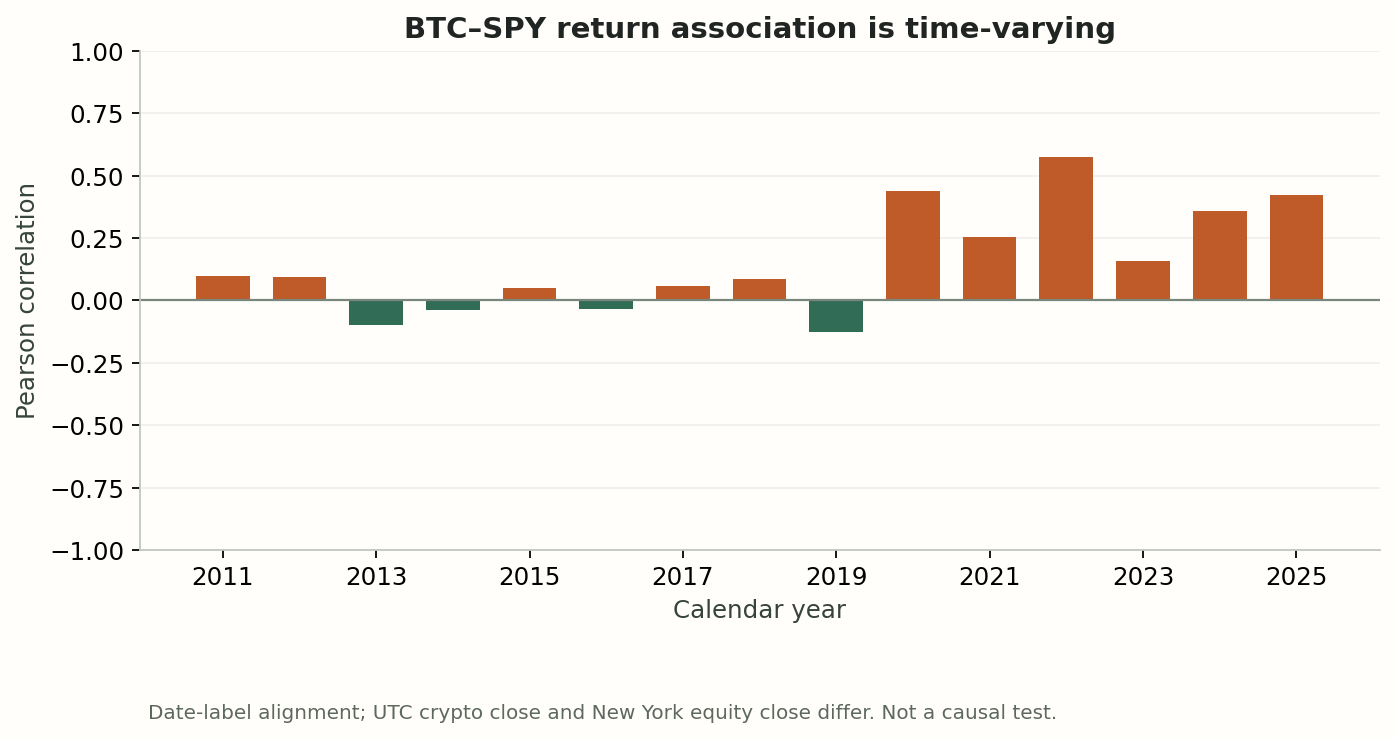
BTC–SPY return correlation is 0.010 in the first CME-era segment, 0.388 in the 2020-to-early-2024 segment and 0.363 in the final segment. Annual estimates vary. This is consistent with studying shared risk conditions, not with treating Bitcoin as permanently independent of equities or assigning all co-movement to institutional demand.
The IMF independently documented stronger crypto–equity connections across pre-pandemic and pandemic samples. Its dates, sources and estimation conventions differ from ours, so our table is not presented as a replication of its exact estimates. Shared monetary conditions, risk appetite, leverage and participant overlap are candidate explanations that need separate evidence.
The recent clock-bucket test does not show a sharp US-session shift
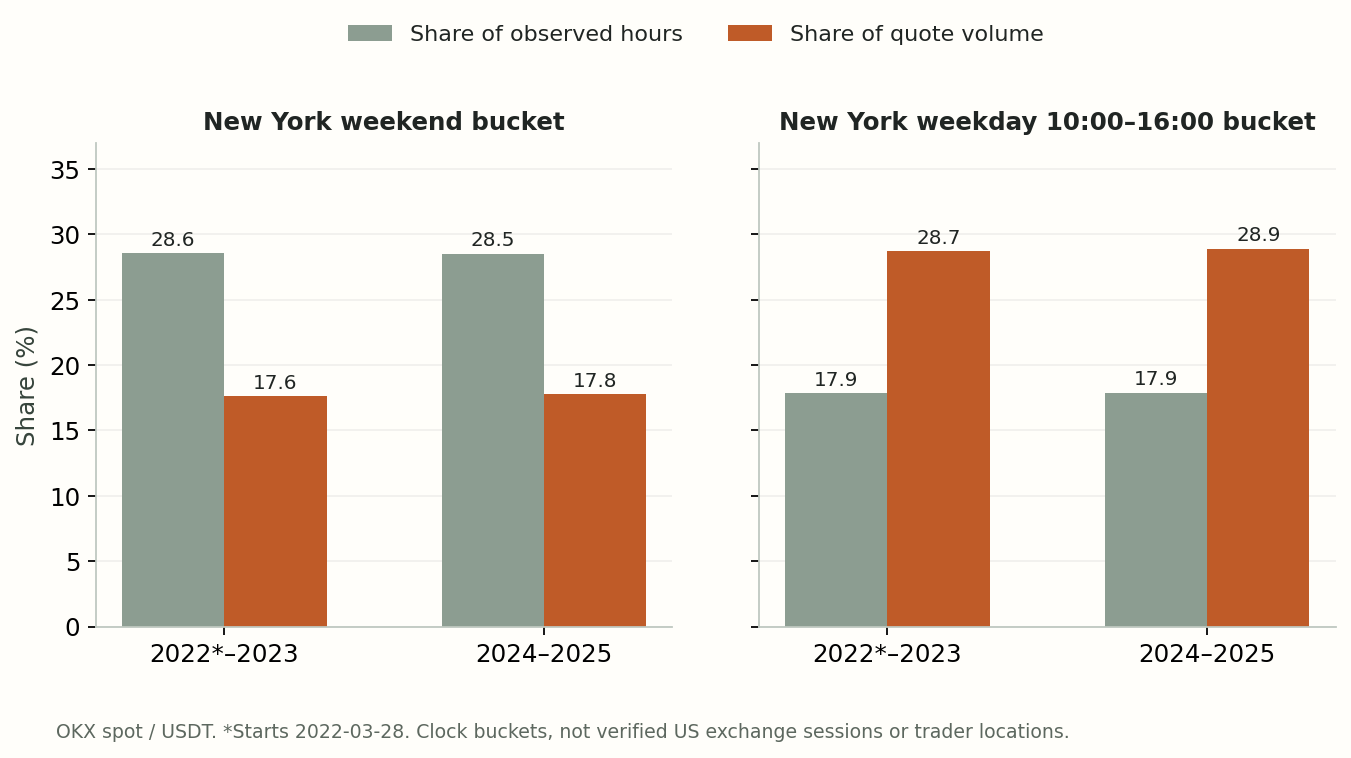
In the available OKX hourly sample, the New York weekday 10:00–16:00 clock bucket accounts for 28.71% of quote volume in the first comparison and 28.91% in the second, against approximately 17.86% and 17.88% of observed hours. Weekend volume shares are 17.63% and 17.78%, below their approximately 28.57% and 28.52% shares of hours. There is activity concentration in these clock buckets, but little change between the two samples.
This does not support a story of an abrupt migration into US hours after ETF access in this venue sample. It also cannot disprove changes elsewhere. Time zones identify clock time, not trader residence. We adjust for New York daylight saving time but do not remove exchange holidays or early closes, so the weekday bucket must not be labelled the exact US stock-market session.
Methods, coverage and the limits of comparison
Daily risk statistics use Coin Metrics BTC PriceUSD from a prior-day baseline at 31 December 2010 through 31 December 2025. Simple close-to-close percentage returns require consecutive calendar days; all dates in that range are present with positive prices. Volatility is the sample standard deviation multiplied by sqrt(365). P99 uses sorted absolute returns at floor((N − 1) × 0.99), without interpolation. Full-year observations stop at 2025 even though this article was reviewed in 2026.
For correlation we match BTC UTC closing-price labels to saved adjusted SPY daily-price labels, then calculate returns between successive matched equity dates. A Monday BTC interval therefore includes the weekend. The equity close occurs in New York before the same-labelled UTC crypto close, so the clocks are not synchronous. This broad association measure is not an exact-session or announcement-response study. SPY is an equity-market proxy, not the S&P 500 index series itself.
The activity samples cover 28 March 2022–31 December 2023 and calendar 2024–2025, with 15,456 and 17,520 retained hourly bars. We use confirmed OKX BTC-USDT spot candles, validate unique aligned timestamps, finite OHLCV, price ranges and non-negative volumes, and retain UTC days with all 24 hours. The latter window has one incomplete UTC day excluded. Quote volume is summed in USDT; these single-venue measurements are separate from the USD daily-price dataset and do not measure global volume.
What would actually measure institutional participation?
CME open interest and CFTC trader categories can describe a regulated derivatives channel; futures contain both longs and shorts. ETP units and BTC holdings, creations and redemptions can describe a fund channel; secondary-market turnover and rising dollar AUM are not the same as fresh net buying. ETP share buyers can include retail investors. A converted trust’s existing inventory must not all be counted as new inflow.
Form 13F provides a delayed and incomplete view of some managers’ reportable securities holdings, rather than their complete net Bitcoin exposure. Short positions are not subtracted from the reported long holdings. Wallet size is also not a reliable retail/institutional label because custodians aggregate many users. We have not assembled a validated CME, ETP-flow or 13F time series for this article, and publish no institutional ownership percentage.
Three forward scenarios and what could falsify them
Broader brokerage distribution could increase the importance of fund and derivatives channels. To test that scenario, monitor units and BTC held rather than AUM alone, net creations and redemptions, comparable CME open interest and the persistence of clock-bucket changes across venues. Stable or shrinking channel measures would weaken a simple story of continually rising institutional influence. This is a scenario, not a forecast of price direction.
A second possibility is segmentation: access and liquidity may broaden for BTC without doing the same for long-tail tokens. A third is stress concentration: a market with more professional intermediaries may still lose liquidity when many participants reduce risk together. Test these with cross-asset coverage, spreads, depth and stress-period withdrawals. Neither “institutions remove crashes” nor “all altcoins follow the same institutional cycle” is established by our sample.
When did institutions start entering the Bitcoin market?
There is no single transition date established here. CME futures and spot Bitcoin ETPs, commonly discussed as spot ETFs, document expanded access. Their launch dates do not identify who traded, the institutional share of ownership or when institutions took control.
Did spot Bitcoin ETFs make BTC move like the stock market?
The article reports BTC–SPY historical association across selected periods, not the isolated effect of ETF access. Market conditions and the alignment of equity and crypto closing times affect comparisons. SPY is a stock-market proxy, not a measure of institutional Bitcoin ownership.
Limitations
Descriptive, unequal-length periods chosen around known milestones; no causal identification, statistically estimated transition date or ownership census. Daily and hourly sources, currencies and clocks differ and remain separate. The activity sample begins in 2022, and no validated fund-flow or institutional-position series has been assembled. Future scenarios are testable hypotheses, not predictions or trading rules.
Sources and data access
- CME: Bitcoin futures launch and first trade date
- CME: initial listing of Micro Bitcoin futures
- SEC: approval of spot Bitcoin ETP shares
- Coin Metrics: public BTC daily data and price definitions
- Coin Metrics: UTC closing-price convention
- SPY historical equity-price data provider
- OKX market data documentation
- IMF: crypto–equity connections across market conditions
- SEC: Form 13F scope and reporting limitations
- CFTC: historical Commitments of Traders data
Cited sources document external facts or data formats; they do not endorse our findings. The public snapshot contains the table and methods. Source-file fingerprints are included for recalculated datasets. Full archived raw files are not distributed here; fingerprints identify the files used, rather than independently proving the results.
Aggregate data snapshot (JSON) · Markdown · Methods and limitations
Live prior 30-day hourly baseline — separate from the historical study
Only the current watch list is shown, up to 12 assets. Missing or stale estimates remain unavailable. Venue and quote currency are kept separate; beta needs matching BTC data. Hourly statistics are not minute-move probabilities.
Observation cutoff (UTC): 20/10/2026, 14:59
| Asset | Source | Bars / expected | Median |r| (%) | P99 |r| (%) | BTC Beta | Matched N | Last close (UTC+8) | Status |
|---|---|---|---|---|---|---|---|---|
| BTC | OKX · USDT | 720/720 | 0.1475 | 1.2319 | 1.0000 | 719 | 20/10/2026, 14:00 | Ready |
| SUI | OKX · USDT | 720/720 | 0.5274 | 3.6976 | 2.0639 | 719 | 20/10/2026, 14:00 | Ready |
| DOGE | OKX · USDT | 720/720 | 0.3218 | 2.2931 | 1.5567 | 719 | 20/10/2026, 14:00 | Ready |
| ETH | OKX · USDT | 720/720 | 0.1935 | 1.4580 | 1.1170 | 719 | 20/10/2026, 14:00 | Ready |
| SOL | OKX · USDT | 720/720 | 0.2810 | 2.0082 | 1.4169 | 719 | 20/10/2026, 14:00 | Ready |
| XRP | OKX · USDT | 720/720 | 0.2671 | 2.2883 | 1.4347 | 719 | 20/10/2026, 14:00 | Ready |
| PEARL | — | 0/720 | — | — | — | 0 | Not available | Unavailable: incomplete or stale |
| JCT | — | 0/720 | — | — | — | 0 | Not available | Unavailable: incomplete or stale |
| QTC | — | 0/720 | — | — | — | 0 | Not available | Unavailable: incomplete or stale |
| CARDS | OKX · USDT | 720/720 | 1.0417 | 8.7874 | 1.5440 | 719 | 20/10/2026, 14:00 | Ready |
| PENGU | OKX · USDT | 720/720 | 0.5787 | 3.9774 | 2.1522 | 719 | 20/10/2026, 14:00 | Ready |
| NEAR | OKX · USDT | 720/720 | 0.7887 | 5.0974 | 2.1840 | 719 | 20/10/2026, 14:00 | Ready |
Related live archives
Related research
Altcoin beta to Bitcoin: BTC, ETH, SOL and DOGE hourly returns
Compare hourly returns, volatility and Bitcoin beta for BTC, ETH, SOL and DOGE using OKX spot data, with sample counts and a separate live baseline.
Perpetual funding rates and annualized yield: a 2025 comparison
Compare 2025 Binance perpetual funding rates for BTC, ETH, SOL and BNB. Funding-rate totals differ from account returns and guaranteed annual yield.
Bitcoin halving and bull markets: evidence from four halvings
Compare Bitcoin returns and drawdowns around four halvings. Positive one-year endpoints in this sample do not prove that halving alone causes a bull market.
Bittensor (TAO): Bitcoin beta, volatility and the AI crypto narrative
Study Bittensor TAO volatility and Bitcoin beta using Binance spot data. Separate the AI crypto narrative, network activity and token-holder value.